



Author
Ahmed Barakat
Author

Share

Fact Checked by
CryptoNews Editorial Team
Author

XRP price is hovering at the $1.50 level, down 8% over the prior 24 hours after failing to hold the $1.60 level. The drop happens even as U.S. spot XRP ETFs pulled in $18.04 million in net inflows during the previous session. The gap forces a blunt question onto the desk: if demand for regulated funds keeps showing up and the token still can’t hold its highs, how much weight does that demand actually carry against spot-market selling?
XRP’s 24-hour range ran from $1.60 down to $1.46, meaning the token was sitting at the bottom of its own daily band. Market capitalization fell to $92 billion, keeping XRP fifth by market cap. Against Bitcoin, XRP slipped 5.6% to 0.00001755 BTC, confirming the move wasn’t purely a dollar-denominated dip.
Discover: Best Crypto IPO this September
Why ETF Inflows Did Not Stop XRP Price Drop?
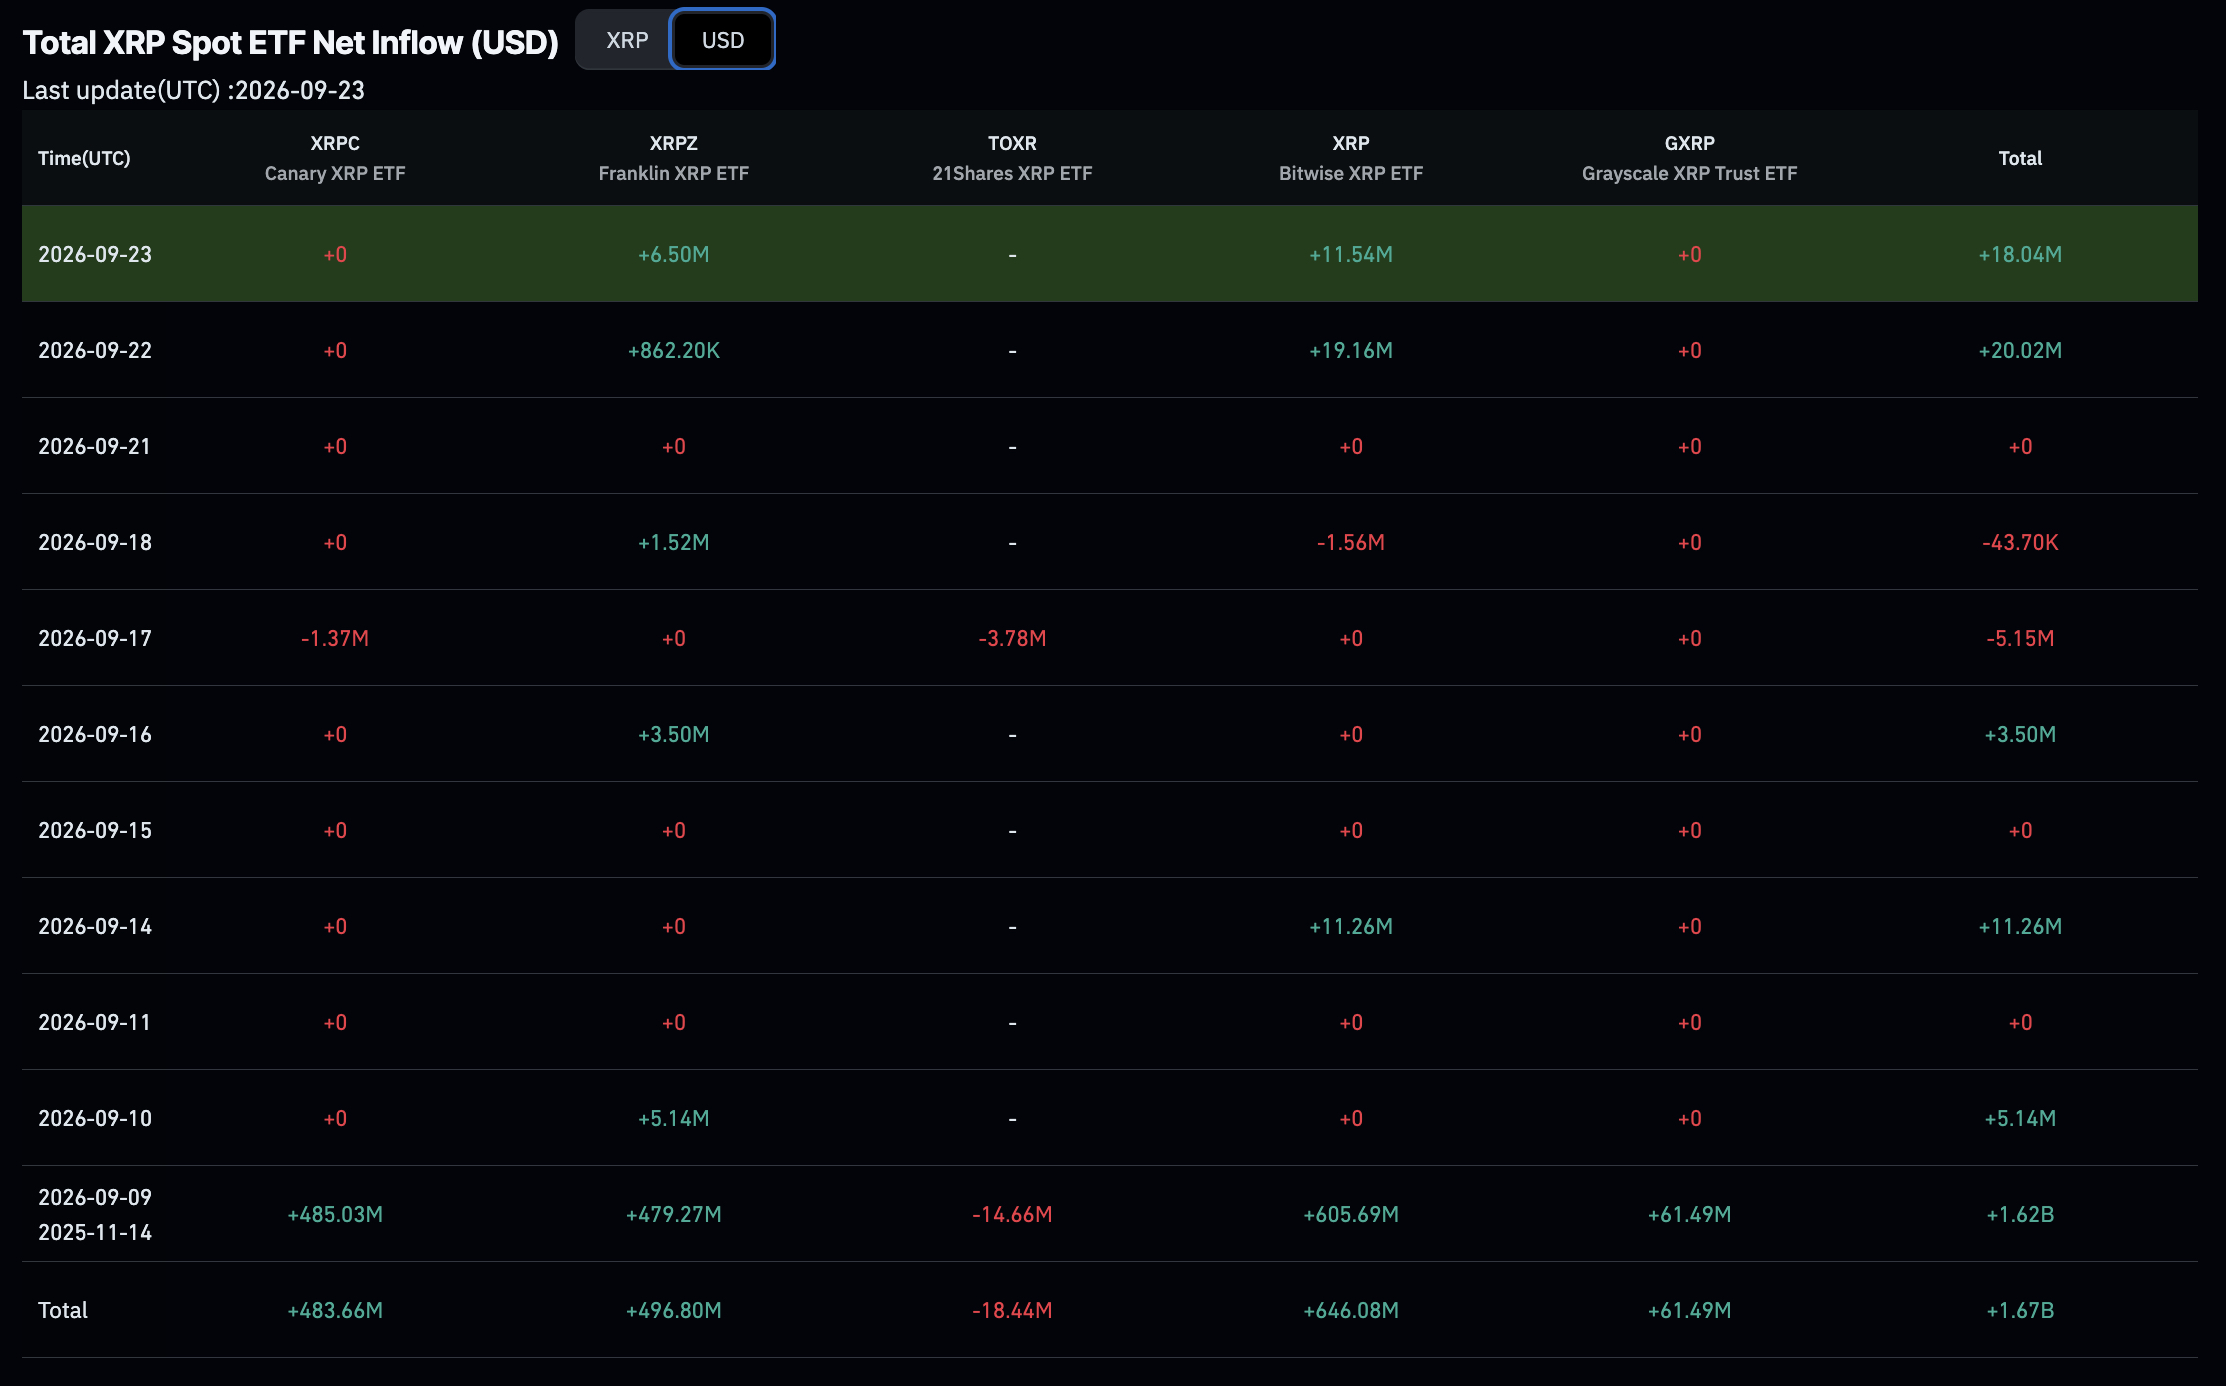
The Bitwise XRP ETF led Tuesday’s inflows with $11.54 million, lifting its cumulative total to $646.08 million, while Franklin Templeton’s XRPZ added $6.50 million to reach $496.80 million cumulatively. Across all XRP ETFs, net inflows reached $18.04 million, taking cumulative inflows since launch to roughly $1.67 billion.
Total net assets actually fell from $1.731 billion in the prior session despite the fresh inflows. That decline can be explained by XRP’s lower price, which reduced the market value of the tokens already held by the funds.
The scale of the new money also remains relatively small compared with XRP’s spot market. The $18.04 million ETF inflow represented roughly 0.44% of the $4.1 billion in XRP spot volume over 24 hours. The two measurements use different time windows, with ETF flows covering a U.S. trading session and spot volume covering a rolling 24-hour period, but the comparison still shows the ETF inflow was modest relative to overall trading activity.
CoinGecko’s own market note points to profit-taking as the session’s primary driver. XRP price ran from about $1.29 to $1.38 on September 18, then pushed toward $1.60 over the following days. It was a move that left recent buyers sitting on gains once the price stalled below resistance.
Elevated Binance deposits add a possible distribution signal to that story, but a deposit isn’t a sale. Tokens moving onto an exchange can reflect trading, market-making, custody shifts, or collateral posting just as easily as outright liquidation.
On-chain data adds a second layer. Santiment put XRP’s 365-day MVRV ratio at -11.75% on September 23, meaning the average holder active over the past year is sitting on an unrealized loss. That’s consistent with rallies drawing sell orders from traders trying to reduce exposure.
Earn $50 and Enter $300K Prize Draw on EdgeX
Technical Levels: $1.60 Rejection and $1.45 Support
The sell-off unfolded in three distinct legs. XRP traded near $1.60 late on September 23 before the first sharp break, which took it from $1.58 to about $1.52. It then chopped sideways between $1.49 and $1.52 overnight, with a failed recovery attempt lifting the price back toward $1.52 near 11:00 IST on September 24 before buyers gave up.
The final leg started after 13:45 IST, when XRP broke below $1.48 and reached $1.46 by roughly 15:00 IST. That marks a second failed attempt this week to establish price above the $1.60 zone, following a similar test on September 22.
| Level | Price | Role |
| Failed high | $1.60 | Resistance rejected twice this week |
| Lost round number | $1.50 | Broken during the final leg of the lower |
| 24-hour low | $1.46 | Session low at time of snapshot |
| Reference support | $1.45 / $1.40 | Nearby levels from recent coverage |
| Deeper support zone | $1.30–$1.35 | Region watched if $1.40 fails |
These are reference points drawn from recent trading, not forecasts. XRP’s futures positioning around the move matters for how sharp the next leg gets, since a crowded book on either side tends to accelerate whichever direction price breaks.
Trade XRP on Bybit and Get a Chance to Win Our $1,000 USDT Airdrop
